Armstrong Real Estate Trends
Check out our Armstrong real estate trends and market statistics below.

Check out our Armstrong real estate trends and market statistics below.
The second quarter just wrapped up on June 30, 2020.
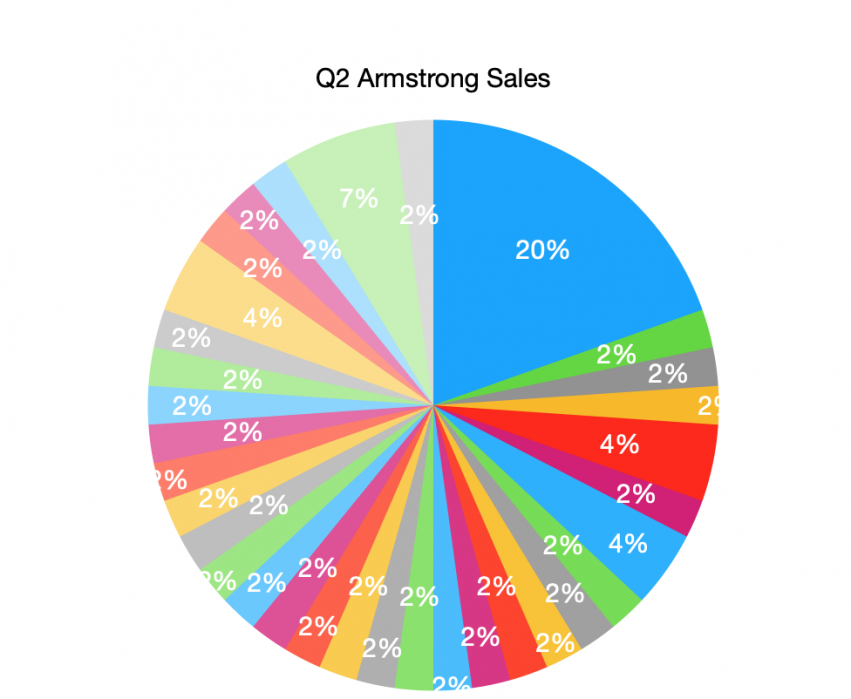
46 properties were sold in Armstrong Spallumcheen April 1 - June 30, 2020.
Chris Holm & Associates represented 9 of those sellers.
We achieved an average of 97.45% of asking price.
Other REALTORS® averaged 94.49%
That 2.95% applied to the average sale price of $499,402.00 means our clients put an average of $14,743.69 more in their jeans.

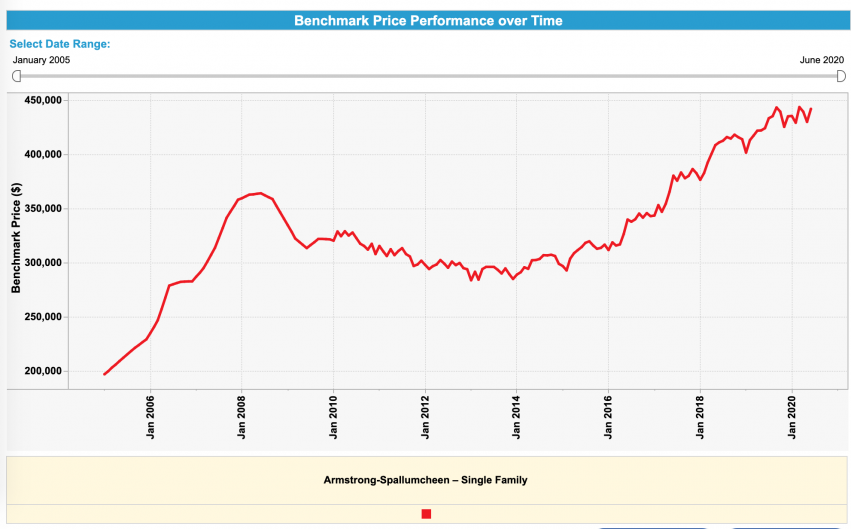
The MLS® HPI is a measure of real estate prices that provides a clearer picture of market trends over traditional tools such as mean or median average prices.
A mean average is an average price obtained by dividing the total dollar volume of sales by the number of sales.
To get a median price, all of the sales prices are arrayed in numeric order. In the case of an even number of sales, the median is the highest price in the lower half of the group. If there is an odd number of sales, the midpoint sale is taken as the median.
The MLS® HPI concept is modeled after the Consumer Price Index, which measures the rate of price change for a basket of goods and services. A basket is the combination of goods and services that Canadians buy most such as food, clothing, transportation, etc.
Instead of measuring goods and services, the MLS® HPI measures the rate at which housing prices change over time taking into account the type of homes sold.
Note: The MLS® HPI offers only a benchmark in which to track price trends and consumers should be careful not to misinterpret index figures as actual prices. Benchmark properties are considered average properties in a given community and do not reflect any one particular property.

| Status: Sold (77) Jan 1 - June 30, 2020 | |||||||
| List Price | Sold Price | DOM | Beds | Total Baths | Finished Floor Area | ||
| Min | $35,900 | $33,500 | 7 | 1 | 1 | ||
| Max | $1,329,900 | $1,500,000 | 448 | 6 | 4 | 4359 | |
| Avg | $489,721 | $476,543 | 82 | 3 | 2 | 1669 | |
| Sum | $37,708,496 | $36,693,820 | |||||
Criteria: MLS is 'OMREB'Major Area is 'North Okanagan' Sub-Area is 'AS - Armstrong/ Spall.' Sold Date is 1/1/2020 to 6/30/2020 |
The property mix in this report contains 55 homes, 5 apartments, 8 townhouses, 2 manufactured homes, and 7 land property sales.
2019 Property Sales in Armstrong & Spallumcheen
| Status: Sold (178) | |||||||
| List Price | Sold Price | DOM | Beds | Total Baths | Finished Floor Area | ||
| Min | $48,900 | $37,000 | 4 | 1 | 1 | ||
| Max | $2,870,000 | $2,500,000 | 716 | 10 | 7 | 5093 | |
| Avg | $504,620 | $487,565 | 87 | 3 | 2 | 1900 | |
| Sum | $89,822,385 | $86,786,566 | |||||
Criteria: MLS is 'OMREB'Major Area is 'North Okanagan' Sub-Area is 'AS - Armstrong/ Spall.' Sold Date is 1/1/2019 to 12/31/2019 |
The property mix in this report contains 135 homes, 5 apartments, 23 townhouses, 6 manufactured homes, and 9 land property sales.
2018 Property Sales in Armstrong & Spallumcheen
Status: Sold in 2018 (170) | |||||||
List Price | Sold Price | DOM | Beds | Total Baths | Finished Floor Area | ||
Min | $39,900 | $20,000 | 1 | 1 | 1 | ||
Max | $2,380,000 | $2,000,000 | 507 | 7 | 6 | 7598 | |
Avg | $501,934 | $483,907 | 75 | 3 | 2 | 1957 | |
Sum | $85,328,797 | $82,264,144 | |||||
Criteria: | MLS is 'OMREB' Major Area is 'North Okanagan' Sub-Area is 'AS - Armstrong/ Spall.' Sold Date is 1/1/2018 to 12/31/2018 Property Type is one of 'Single Family Residential', 'Strata', 'Manufactured Home', 'Lots and Acreages', 'Recreation' |
The property mix in this report contains 127 homes, 7 apartments, 17 townhouses, 12 manufactured homes, and 7 land property sales.
Terms of Use
This website is operated by Chris Holm Associates/Chris Holm, REALTOR®, a Salesperson who is a member of The Canadian Real Estate Association (CREA). The content on this website is owned or controlled by CREA. By accessing this website, the user agrees to be bound by these terms of use as amended from time to time, and agrees that these terms of use constitute a binding contract between the user, Chris Holm Associates/Chris Holm, REALTOR®, and CREA.
Copyright
The content on this website is protected by copyright and other laws, and is intended solely for the private, non-commercial use by individuals. Any other reproduction, distribution or use of the content, in whole or in part, is specifically prohibited. Prohibited uses include commercial use, “screen scraping”, “database scraping”, and any other activity intended to collect, store, reorganize or manipulate the content of this website.
Trademarks
REALTOR®, REALTORS®, and the REALTOR® logo are certification marks that are owned by REALTOR® Canada Inc. and licensed exclusively to The Canadian Real Estate Association (CREA). These certification marks identify real estate professionals who are members of CREA and who must abide by CREA’s By-Laws, Rules, and the REALTOR® Code. The MLS® trademark and the MLS® logo are owned by CREA and identify the professional real estate services provided by members of CREA.
Liability and Warranty Disclaimer
The information contained on this website is based in whole or in part on information that is provided by members of CREA, who are responsible for its accuracy. CREA reproduces and distributes this information as a service for its members, and assumes no responsibility for its completeness or accuracy.
Amendments
Chris Holm Associates/Chris Holm, REALTOR® may at any time amend these Terms of Use by updating this posting. All users of this site are bound by these amendments should they wish to continue accessing the website, and should therefore periodically visit this page to review any and all such amendments.