


2017 Property Sales in Silver Star, Vernon, BC
Here is our neighbourhood real estate report for 2017 at Silver Star Mountain. The market here has been slower to recover - but is fairly active now - with many strata properties going into multiple offer competitions. Note that land sales have also occurred - which bodes well for the future.
Status: Sold (72) | ||||||
List Price | Sold Price | DOM | Beds | Total Baths | Finished Floor Area | |
Min | $118,000 | $115,000 | 1 | 1 | ||
Max | $1,190,000 | $1,025,000 | 915 | 7 | 6 | 4361 |
Avg | $381,619 | $369,166 | 190 | 2 | 2 | 1227 |
Sum | $27,476,594 | $26,579,966 | ||||
Criteria:
MLS is 'OMREB'
Major Area is 'North Okanagan'
Sub-Area is 'SS - Silver Star'
Sold Date is 1/1/2017 to 12/31/2017
Property Type is one of 'Single Family Residential', 'Strata', 'Manufactured Home', 'Lots and Acreages', 'Recreation'
The property mix in this report contains 20 homes, 36 apartments, 10 townhouses, and 6 land property sales.
Silver Star Key Performance Indicator Review 2017
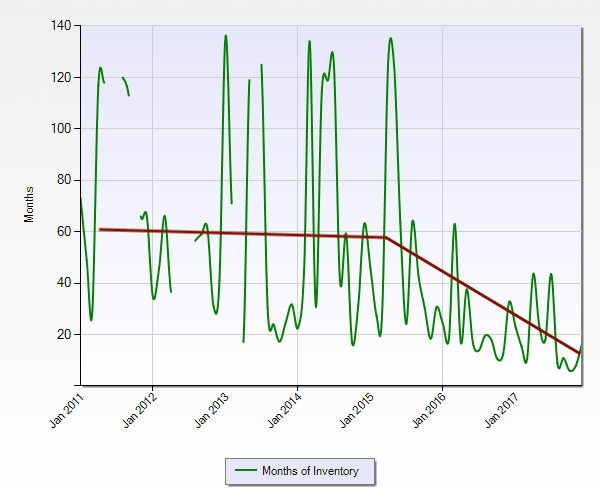
Time frame for the chart above is from Jan 2011 to Dec 2017 and it depicts the absorption rate of real estate specific to the Silver Star sub area or neighbourhood with the North Okanagan zone.
From 2011 to mid 2015 sellers almost always faced absorptions rate of 5 years or more based on the number of properties on the market compared to the number of sales. Fast forward to 2017 where there was less than 12 months supply in some months!
Historic Look At Silver Star Real Estate Sales Volume
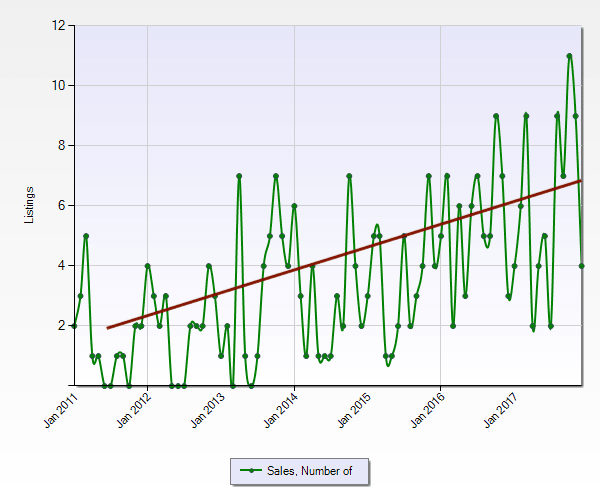
This chart reflects the MLS® property sales by month. The trend line shows clearly that sales volume has climbed steadily - although the jagged variation shows the seasonal nature of Okanagan real estate sales activity - and unlike the rest of the area - more sales in the Winter months overall.
Historic Trend of Active Listings
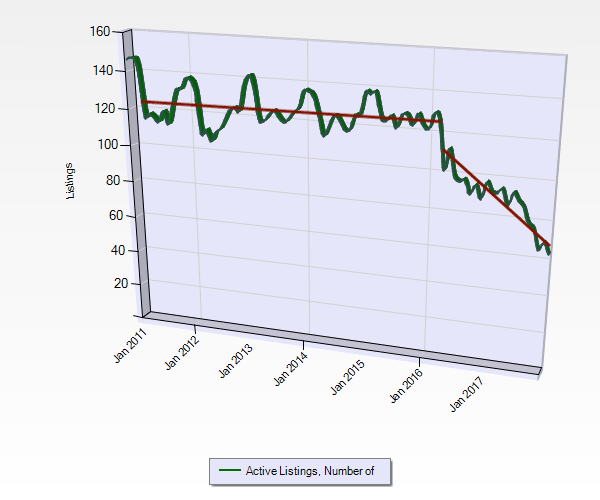
You can see that the number of properties brought to the market in recent years is trending downward. The first chart we showed you - the absorption rate - is a direct result of the reduction of properties coming to market in combination with the second chart - which shows the increase in properties SOLD. Clearly 2016 saw a downward shift in the number of potential sellers in this neighbourhood.
Historic Median / Average Days On Market Trends for Silver Star Residential Sale
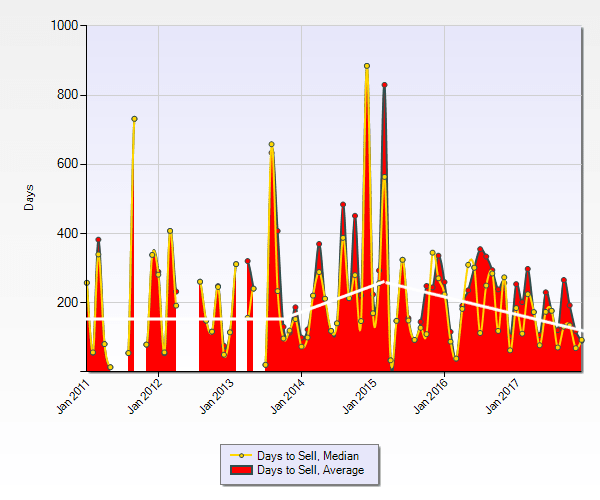
This chart shows the comparison between the average days a property was on the market. ( From Activation to Final Subject Removal) . Silver Star properties generally need more time on the market to get sold - but you can see the trend to shorter list periods began in 2015 and in 2017 if properties were priced right they sold FAST.
Historic Median Sale Price Trend for Silver Star Residential Sales
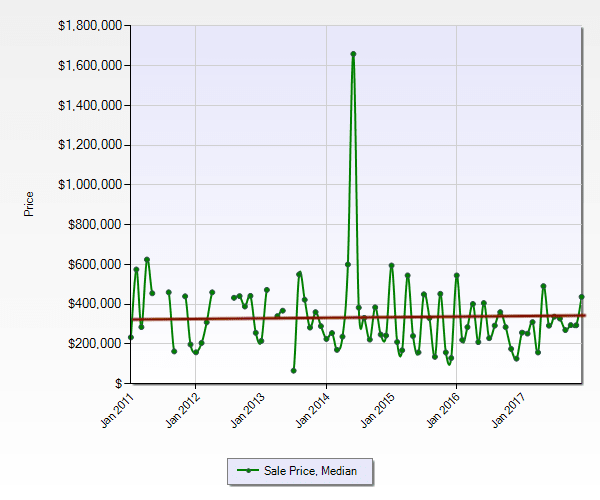
The chart above shows the upward trend of the Median (middle of the market) sale price by month over the last 7 years. Because of the variety of sizes and types of properties sold at Silver Star the measure of the middle of the market is not as meaningful as it is in other neighbourhoods. It is mandatory to evaluate the properties that sold to gain understanding of the true TRENDS.
Thank you for taking the time to look at our Silver Star Spall market synopsis. Please feel free to share it with your friends and neighbours, and especially anyone you may know that might be looking for help selling or buying in Silver Star.
Cheers!
Chris, Brent, Shelby, & Brell
REALTORS® along with the amazing
Diane, Kendra, Natalya and Yania