.png)
.png)


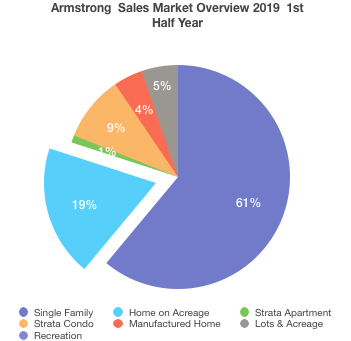
2019 in Armstrong Real Estate 1st Half
Status: Sold in Armstrong (95) | ||||||||||||||||||||||
List Price | Sold Price | DOM | Beds | Total Baths | Finished Floor Area | |||||||||||||||||
Min | $48,900 | $37,000 | 4 | 2 | 1 | |||||||||||||||||
Max | $2,870,000 | $2,500,000 | 328 | 6 | 5 | 4500 | ||||||||||||||||
Avg | $520,497 | $501,015 | 79 | 3 | 2 | 1904 | ||||||||||||||||
Sum | $49,447,197 | $47,596,460 | ||||||||||||||||||||
Criteria: | MLS is ‘OMREB' Major Area is 'North Okanagan' Sub-Area is 'AS - Armstrong/ Spall.' Sold Date is 1/1/2019 to 6/30/2019 |
Absorption Rates
These chart shows the relationship between the amount of sales relative to inventory at intervals over the last 7 years expressed as Months Of Inventory. Where the green line falls within the black outlined box indicates a time in the market that favours BUYERS whereas the Red favours SELLERS.
Single Family Homes
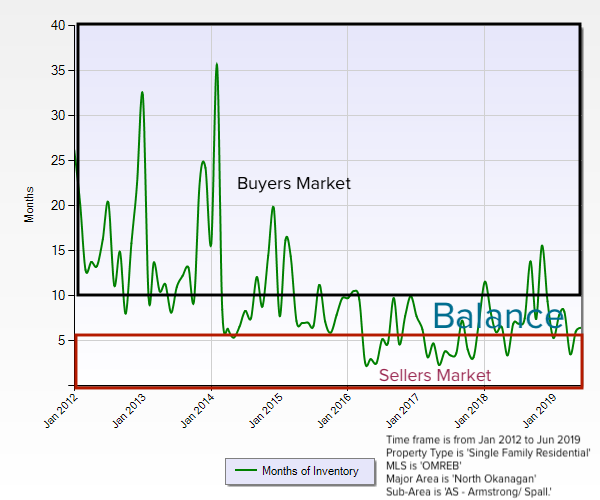
Single Family Homes
ON Acreage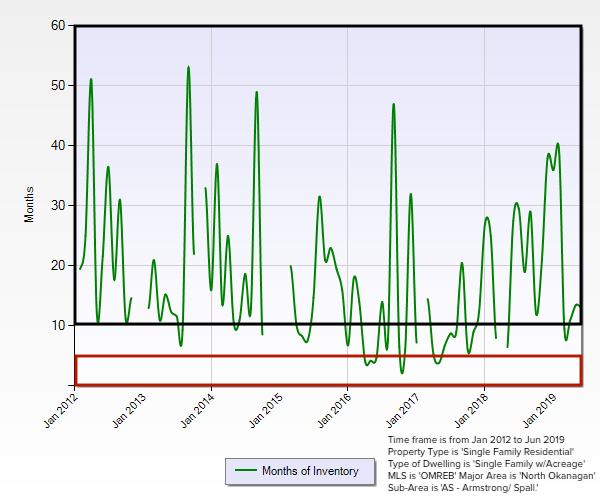 By comparison, you can see that the market for homes on acreage is a totally different market than the Single Family home market in Armstrong. Sellers of homes on acreage rarely have market advantage. While we have seen more balance in this sector since 2016 - the trend indicates that buyers will have more options to select from - but that sellers may find themselves asking for more money than buyers are willing to spend.