Apartment Sales in Vernon BC 2017
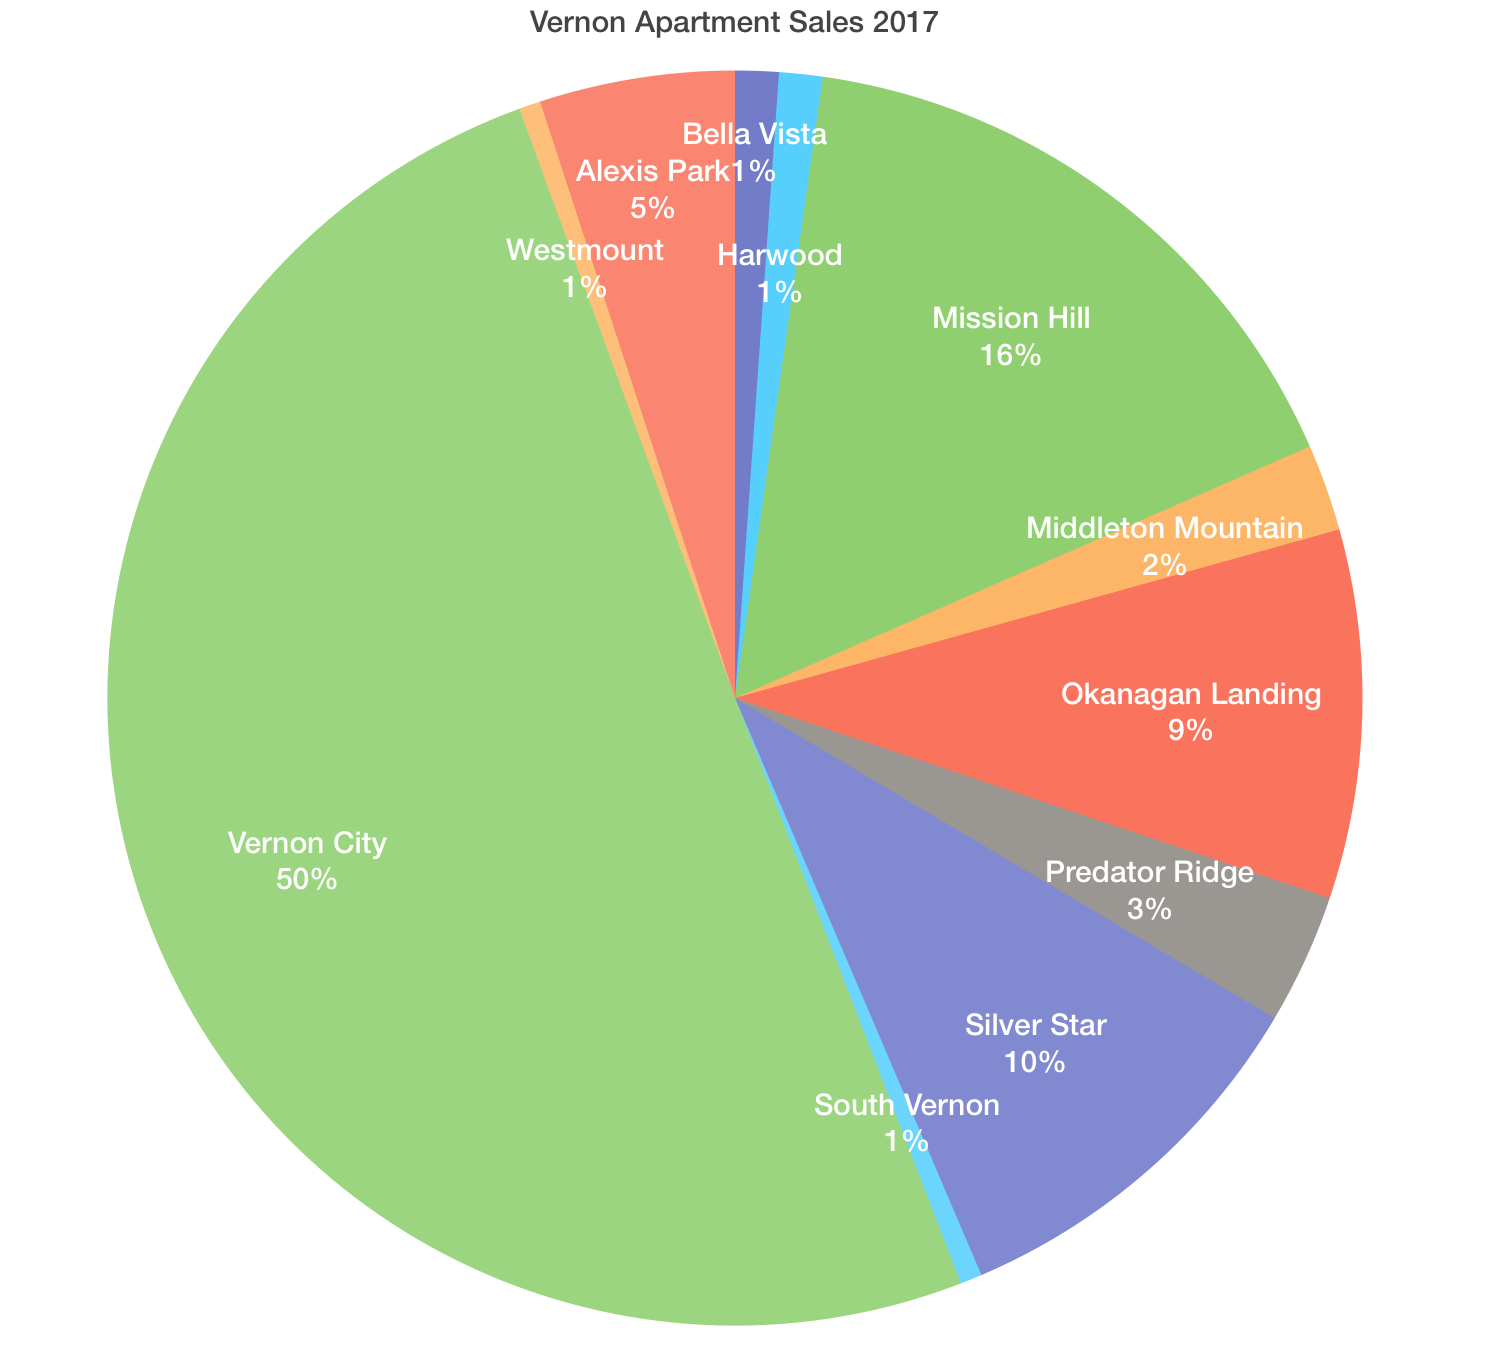
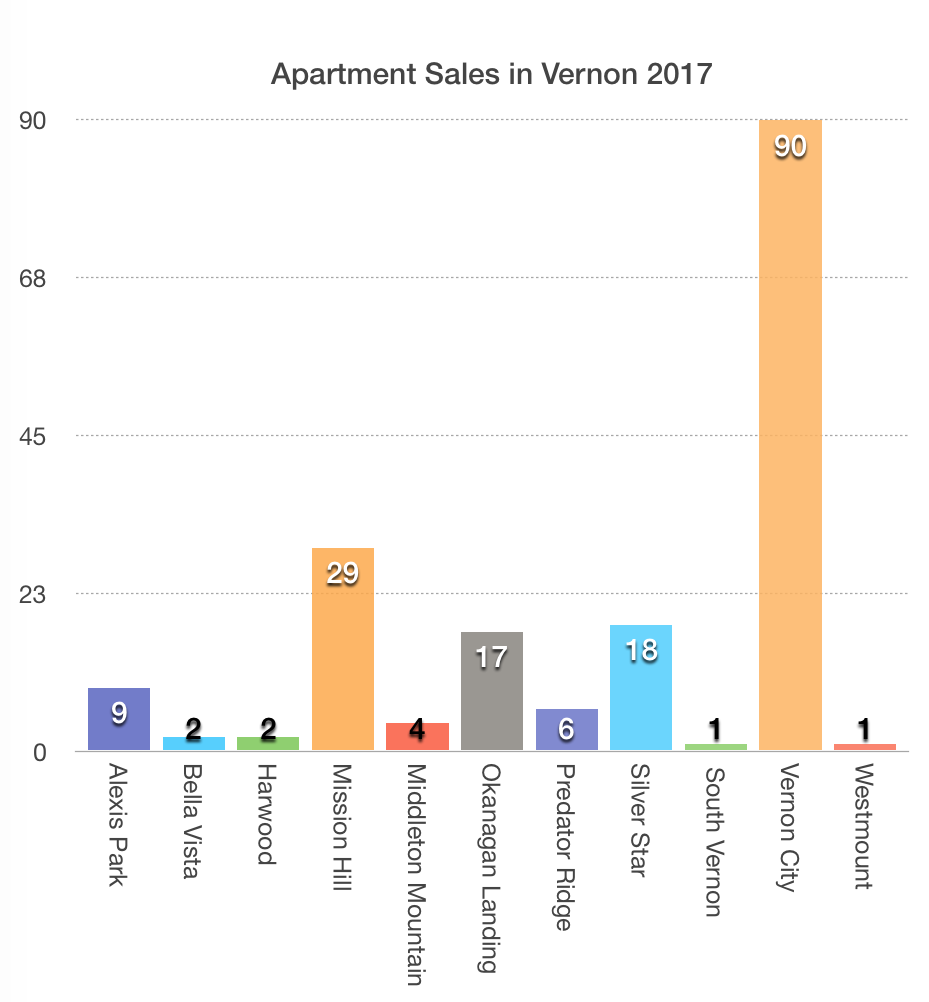
In 2017, there were 169 apartment property sales in the City of Vernon, and of those, predictably, 50% were located in the "Vernon City" neighbourhood. Sale prices ranged from $82,500. to $750, 476. with the average sale price for the year coming in at just over $200,000.
Status: Sold (169) | ||||||
List Price | Sold Price | DOM | Beds | Total Baths | Finished Floor Area | |
Min | $84,900 | $82,500 | 3 | 1 | 432 | |
Max | $798,000 | $750,476 | 1035 | 3 | 3 | 1695 |
Avg | $208,306 | $201,903 | 88 | 2 | 2 | 920 |
Criteria: | MLS is 'OMREB' Major Area is 'North Okanagan' Sold Date is 1/1/2017 to 12/31/2017 Property Type is 'Strata' Type of Dwelling is 'Apartment' City is 'Vernon' |
If you are in the market for an apartment or condo check out this post for things to know!
Key Performance Indicators for the Apartment Sector of Vernon BC real estate
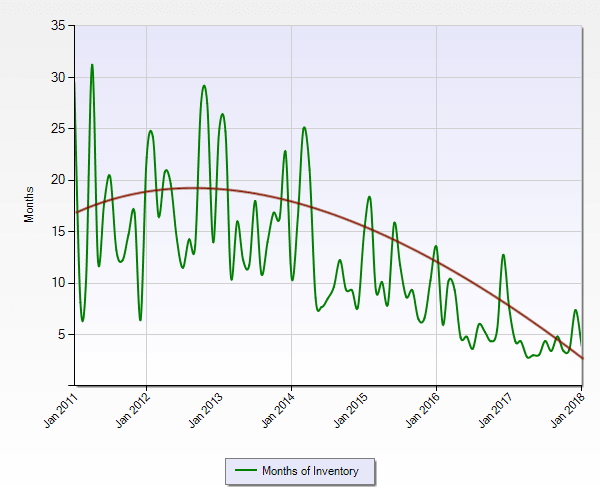
This chart shows the absorption rate or health of the apartment sector across the past 7 years. It represents the number of months of supply at each months rate of demand. You can see the shift from a Buyers Market prior to 2014 into a balanced area on 2015 and tipping into a Sellers market in 2016 forward.
Vernon BC Apartment Sales Trend
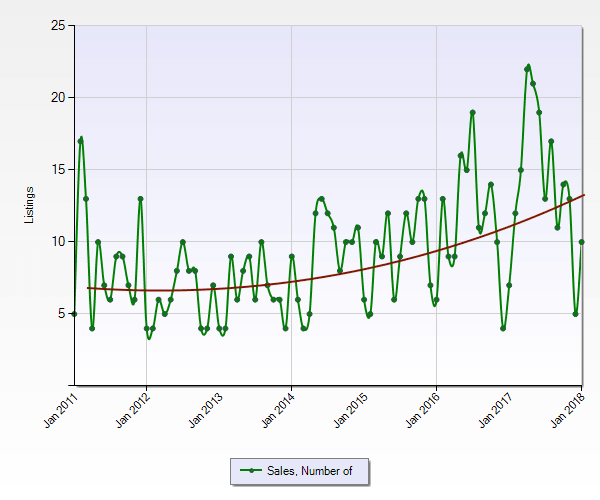
This chart shows the number of apartment sales in Vernon per month over the last 7 years, and shows the increase in the number of sales trending upward.
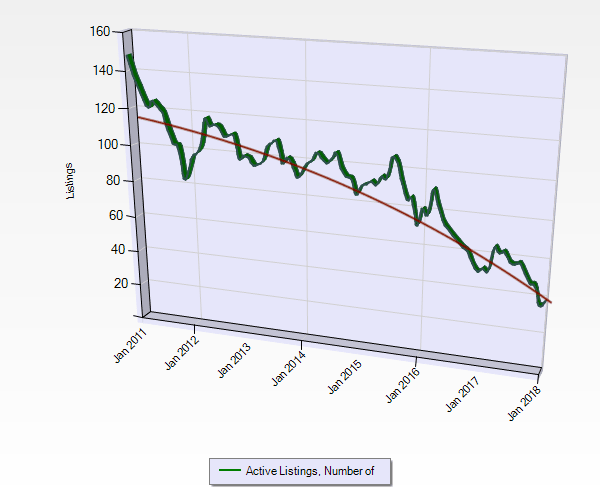
Vernon BC Apartment Active Listings Trend
The amount of properties available to purchase has dropped dramatically over the last 7 years... from over 100 to closer to 40-60!
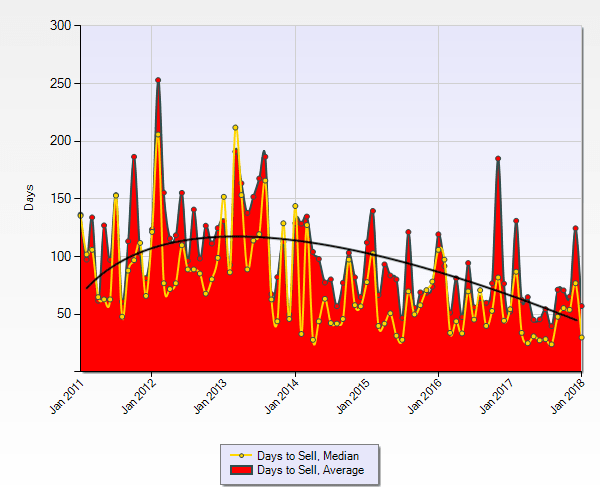
Days to Sell Trend for Vernon Apartments
Mirroring the other charts in favouring sellers - this shows that apartments are selling about twice as fast on overage as they were in 2012 .
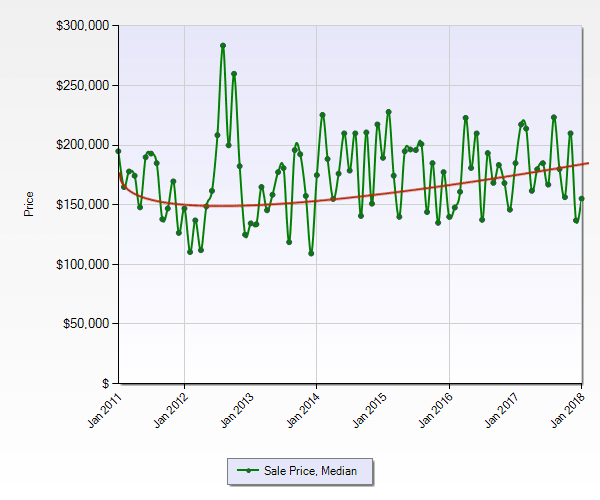
Sales Price Trends for Vernon Apartments
The middle of the market for Vernon Apartment sales has risen about $50,000 over the last 7 years. Naturally - one must look at the make up of WHAT properties sold to determine individual property valuations, however.
.png)
.png)
