Central Okanagan Real Estate Report April 11, 2018
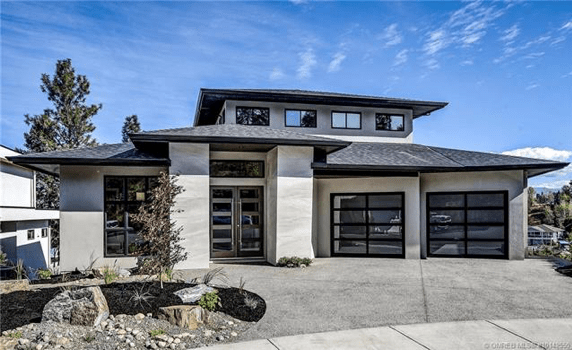
Weekly Top Property – 1106 Westpoint Drive, Kelowna, V1W 4Z
Superior craftsmanship offers a luxurious yet relaxed twist to this gorgeous home built by Lakepointe Homes Ltd. Positioned on a .26 acre ridge lot perched above vineyard, offering breathtaking vistas from every room. The main floor welcomes you with a large front foyer with 9” white oak h/w floors, open concept living and seamless transition into outdoor living space with 2 walls featuring eclipse doors opening up to view deck. Chef inspired kitchen, butler’s pantry, Thermador s/s app. oversized island w/ Cambria waterfall. Main floor also features a generous sized dining area that will accommodate all of your guests and a home office. The 2nd floor is exclusive to a well appointed Master retreat with large private deck, luxurious spa-like ensuite, his & her walk-in closets with custom built cabinetry and rough in for washer and dryer. The lower level leads to a family/recreation room with bar, 2 generous sized bedrooms, 2 bath and laundry. Large patio doors open up to 12' x 24' concrete tiled infinity edge pool where indoor & outdoor living spaces flow seamlessly together. 2 dishwashers, 2 beverage coolers, 2 gas fireplaces, total of 3 spacious bedrooms and 3 full baths.
Based on 2016 taxes = $1,974
Sales rebounded in the Central Okanagan this week with 27 more transactions reported and an overall sales volume of almost $67.5 million! The average sale price rose only slightly.
Here is a look at the basic statistics for residential real estate sales:
| Status: Sold (115) | |||||||
| List Price | Sold Price | DOM | Beds | Total Baths | Finished Floor Area | ||
| Min | $104,900 | $96,000 | 1 | 1 | 1 | ||
| Max | $1,899,900 | $1,800,000 | 364 | 6 | 6 | 5080 | |
| Avg | $603,318 | $586,470 | 59 | 3 | 2 | 1778 | |
| Sum | $69,381,551 | $67,444,021 | |||||
Criteria:
|
Compared to last week
| Status: Sold (88) | |||||||
| List Price | Sold Price | DOM | Beds | Total Baths | Finished Floor Area | ||
| Min | $109,000 | $105,000 | 3 | 1 | |||
| Max | $3,295,000 | $3,095,000 | 281 | 11 | 6 | 5400 | |
| Avg | $592,259 | $578,043 | 47 | 3 | 3 | 1882 | |
| Sum | $52,118,775 | $50,867,779 | |||||
| Breakdown of the Sales for the Week | |
| Lots & Acreages | 7 |
| Manufactured Homes | 5 |
| Recreational | 1 |
| Single Family Residential | 55 |
| Strata - Apartments | 29 |
| - Townhouses | 18 |
.png)
.png)