.png)
.png)


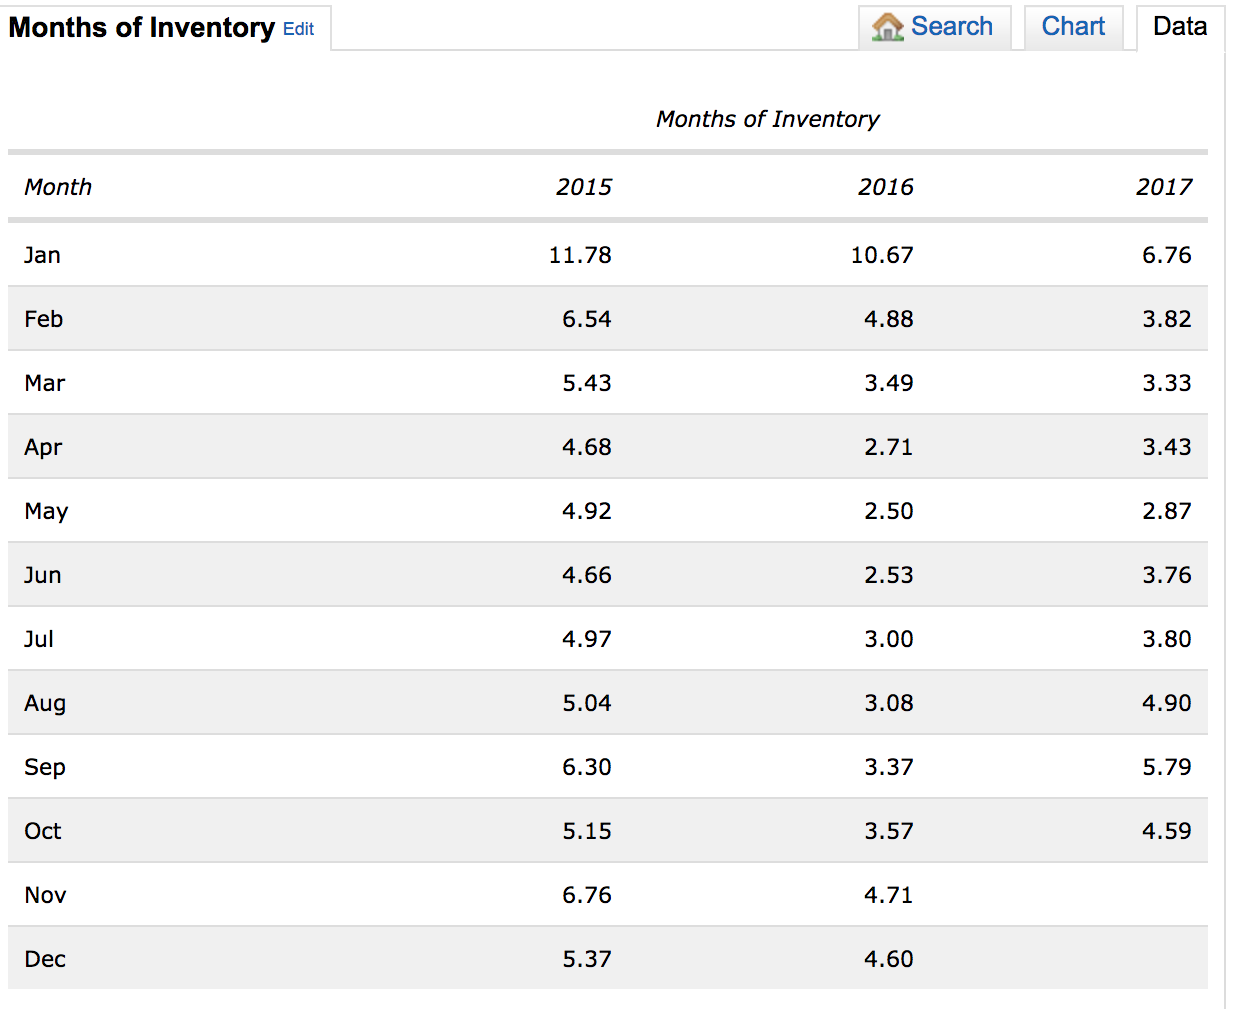
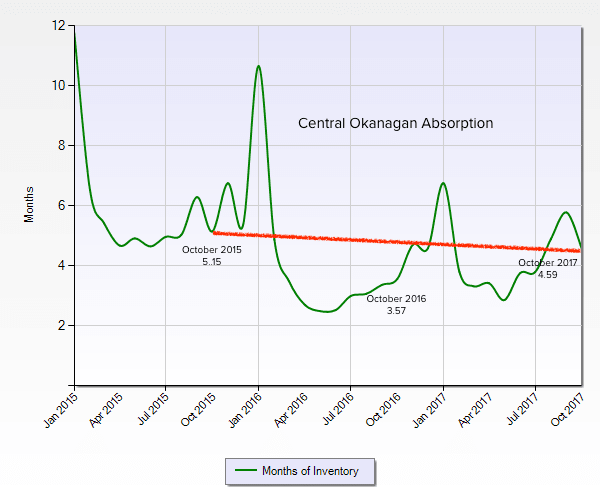
Central Okanagan Residential Real Estate Statistics October, 2017
Information in this post is based on MLS® listing activities reported October 1- October 31, 2017.
Condo/Apartments
| Sales | 117 |
| New Listings | 162 |
| Current Inventory | 330 |
| Number of Months | 3 |
| Sell/Inv. Ratio | 35.45% |
| Days to Sell | 65 |
| Days – Range | 7 to 504 |
| Average Price | $318,812 |
| Median Price | $301,000 |
| Price - Range | $41,000 - $1,569,900 |
| Hottest Neighbourhood | Kelowna North |
Condo/Townhouses
| Sales | 75 |
| New Listings | 85 |
| Current Inventory | 196 |
| Number of Months | 3 |
| Sell/Inv. Ratio | 38.27% |
| Days to Sell | 58 |
| Days – Range | 8 to 168 |
| Average Price | $454,451 |
| Median Price | $440,000 |
| Price - Range | $197,500 - $876,000 |
| Hottest Neighbourhood | Lower Mission |
Lots & Acreages
| Sales | 71 |
| New Listings | 94 |
| Current Inventory | 342 |
| Number of Months | 5 |
| Sell/Inv. Ratio | 20.76% |
| Days to Sell | 99 |
| Days – Range | 4 to 940 |
| Average Price | $344,068 |
| Median Price | $202,900 |
| Price - Range | $75,000 - $5,550,000 |
| Hottest Neighbourhood | Lake Country South West |
 Residential Homes
| Sales | 220 |
| New Listings | 333 |
| Current Inventory | 866 |
| Number of Months | 4 |
| Sell/Inv. Ratio | 25.40% |
| Days to Sell | 54 |
| Days – Range | 6 to 434 |
| Average Price | $672,434 |
| Median Price | $634,000 |
| Price - Range | $165,000 - $6,400,000 |
| Hottest Neighbourhood | Rutland North |
Ratio of Sales vs Inventory 29.15%