North Okanagan Residential Real Estate Statistics September, 2017
September 2017 North Okanagan Real Estate Market Update
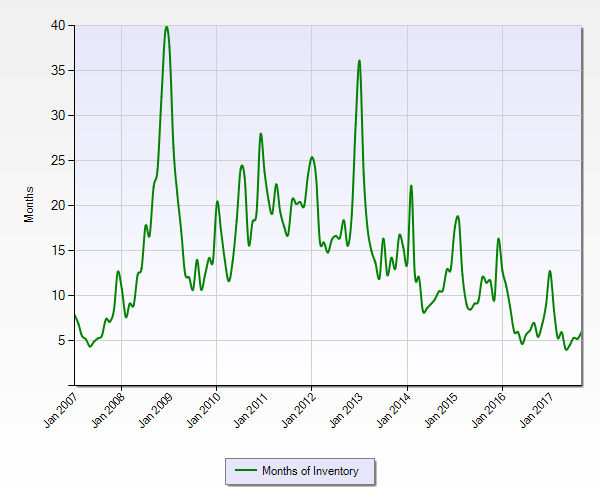
Here is a look at the Absorption rate trend in North Okanagan real estate. That is - the number of months it would take to consume the available listings, based on the previousl months demand.
North Zone : (Predator Ridge to Enderby):
The chart below shows the downward trend starting in January of 2013. It also clearly shows the seasonal, cyclical nature of our local real estate market. Currently - there is just over 6 months of market supply in the North Okanagan real estate zone. That is up from a low of 4..10 months earlier (May) 2017. The worst ratio of supply and demand in the last ten years occurred in January 2009, when there was over 37.5 MONTHS of inventory available at the rate of demand.
Meanwhile - in September 2017 the following happened in North Okanagan Real Estate
Top of the Market:
|
| |||||||||||||||||||||||||||||

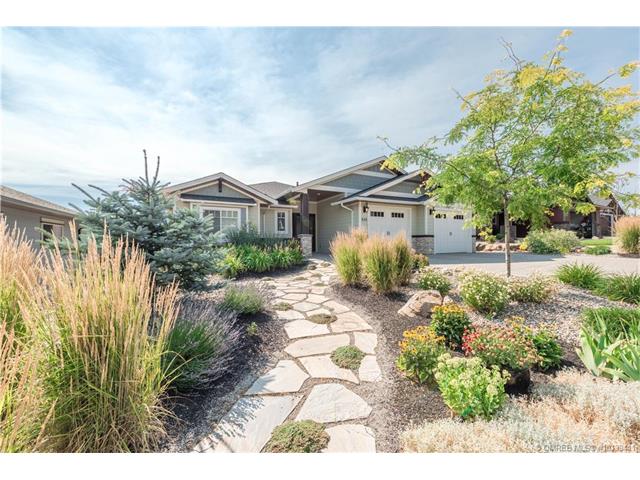
Exquisite custom built home featuring plenty of living space, lots of natural day light and great unobstructed views of Coldstream Valley & Monashee Mountains. This 4 bdrm, 3 bath home still feels like new with no expense spared, exceptional interior finishing with hardwood floors, custom cabinets, granite counters, stone fireplace. Enjoy the open concept living with large kitchen area, island, top end stainless steel appliance, hot water on demand and oversize garage with ample storage. Seperate entrance to a large bonus room under garage could easily be converted into an in-law suite. Great family neighbourhood located in a quiet Cul-De-Sac. Private backyard, East facing deck, backing onto ALR land with walking trails and parks nearby.
Here is a look at the numbers from OMREB - for the North Okanagan Residential MLS® real estate market in . The following charts are based on September 1st - 30th
Monthly Sales statistics are based on the sales reported by real estate offices on or before the last day of the month.
| Condo Apartment | |
| Listings Sold | 16 |
| New Listings | 11 |
| Current Inventory | 75 |
| Absorption Rate Sell/List | 21.33% |
| Months of Inventory on Hand | 5 Months |
| Days to Sell (Average) | 146 |
| Days to Sell (Range) | 17 to 712 |
| Average Sale Price | $198,625 |
| Median Sale Price | $170,000 |
| Range of Sales Prices | $116,000 - $316,000 |
| Hottest Neighbourhood | Vernon City |
| Condo Townhouse | |
| Listings Sold | 30 |
| New Listings | 25 |
| Current Inventory | 78 |
| Absorption Rate Sell/List | 38.46% |
| Months of Inventory on Hand | 3 Months |
| Days to Sell (Average) | 60 |
| Days to Sell (Range) | 4 to 219 |
| Average Sale Price | $376,067 |
| Median Sale Price | $355,125 |
| Range of Sales Prices | $119,900 - $1,392,000 |
| Hottest Neighbourhood | Vernon City |
| Building Lot | |
| Listings Sold | 11 |
| New Listings | 24 |
| Current Inventory | 355 |
| Absorption Rate Sell/List | 3.10% |
| Months of Inventory on Hand | 32 Months |
| Days to Sell (Average) | 165 |
| Days to Sell (Range) | 26 to 513 |
| Average Sale Price | $256,127 |
| Median Sale Price | $281,000 |
| Range of Sales Prices | $51,500 - $498,900 |
| Hottest Neighbourhood | Bella Vista |
| Residential Homes | |
| Listings Sold | 103 |
| New Listings | 104 |
| Current Inventory | 367 |
| Absorption Rate Sell/List | 28.07% |
| Months of Inventory on Hand | 4 Months |
| Days to Sell (Average) | 56 |
| Days to Sell (Range) | 4 to 320 |
| Average Sale Price | $460,778 |
| Median Sale Price | $427,500 |
| Range of Sales Prices | $125,000 - $940,00 |
| Hottest Neighbourhood | East Hill |
Ratio of Sales vs Inventory 24.50%
Totals include variables in any given due to previous month’s collapsed sales and deleted listings. e & eo
.png)
.png)

