.png)
.png)


The Last Month in Armstrong Spall Real Estate
Feb. 18, 2019
With less than 6 months of active inventory - the overall market slightly favours sellers - as long as the seller presents property that outshines it competition and is priced and positioned to sell.
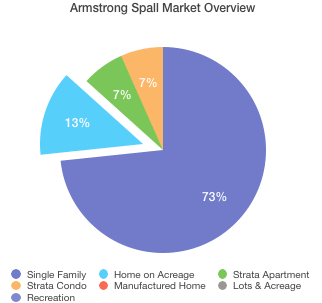
Different sector of the market move at different rates - Homes on acreage for example have 35 choices for buyers and the same type of property posted only 2 sales in the last month - resulting in a BUYERS advantage with 17.5 months of inventory available.
Here is a look at the basic statistics for what sold:
Status: Sold (15) | |||||||
| List Price | Sold Price | DOM | Beds | Total Baths | Finished Floor Area | ||
| Min | $159,000 | $154,000 | 6 | 2 | 1 | 890 | |
| Max | $999,000 | $965,000 | 209 | 6 | 4 | 3795 | |
| Avg | $519,533 | $511,179 | 66 | 3 | 2 | 2036 | |
| Sum | $7,793,000 | $7,667,685 | |||||
Criteria: MLS is 'OMREB'
Major Area is 'North Okanagan' Sub-Area is 'AS - Armstrong/ Spall.'
Sold Date is 1/17/2019 to 2/17/2019
| Status: Listings Activated (20) | |||||||
| List Price | Sold Price | DOM | Beds | Total Baths | Finished Floor Area | ||
| Min | $299,900 | $386,100 | 3 | 2 | 1 | 1080 | |
| Max | $1,450,000 | $576,800 | 31 | 6 | 4 | 4454 | |
| Avg | $629,690 | $508,200 | 16 | 4 | 2 | 2375 | |
| Sum | $12,593,800 | $2,032,800 | |||||
| Status: Activated and Sold (4) | |||||||
| List Price | Sold Price | DOM | Beds | Total Baths | Finished Floor Area | ||
| Min | $379,800 | $386,100 | 6 | 2 | 2 | 1377 | |
| Max | $589,000 | $576,800 | 27 | 4 | 3 | 2915 | |
| Avg | $513,400 | $508,200 | 15 | 3 | 3 | 2185 | |
| Sum | $2,053,600 | $2,032,800 | |||||
| Status: Remaining Active (16) Of New Activations | |||||||
| List Price | Sold Price | DOM | Beds | Total Baths | Finished Floor Area | ||
| Min | $299,900 | - | 3 | 2 | 1 | 1080 | |
| Max | $1,450,000 | - | 31 | 6 | 4 | 4454 | |
| Avg | $658,763 | - | 16 | 4 | 2 | 2423 | |
| Sum | $10,540,200 | ||||||
Status is one of 'Active', 'Sold
'MLS is 'OMREB'
Major Area is 'North Okanagan 'Sub-Area is 'AS - Armstrong/ Spall.'
Activation Date is 1/17/2019 to 2/17/2019