.png)
.png)


SEPTEMBER North Okanagan Real Estate Report 2026

Chris Holm & Associates
We want you to know that our team is unique in the way we chose to approach real estate here in the North Okanagan. We are a true real estate co...
We want you to know that our team is unique in the way we chose to approach real estate here in the North Okanagan. We are a true real estate co...
NORTH OKANAGAN
SEPTEMBER 2026 OVERVIEW
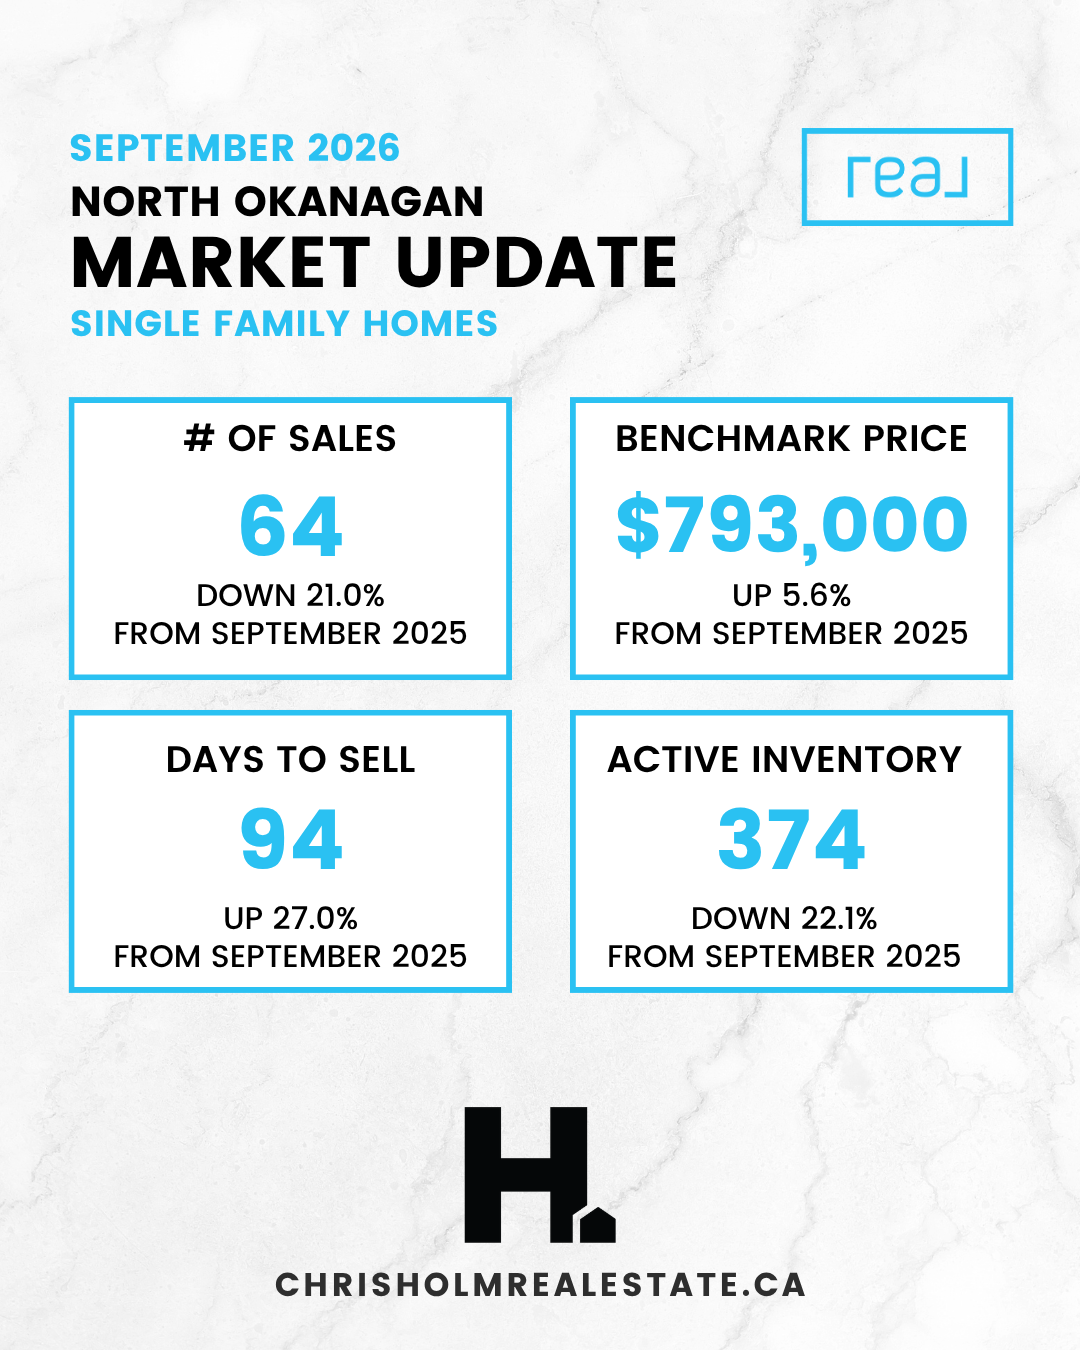
September was a quieter month in the North Okanagan, and quiet is not the same as soft. Sixty four single family homes sold, down 21% from last September, and they took an average of 94 days to get there. But there were also 22% fewer homes on the market, and the benchmark price finished the month at $793,000, up 5.6% over the year. Fewer buyers, fewer sellers, steady prices. If you’re weighing a move, this month’s numbers say more about timing than they do about price.Scroll to see what happened in North Okanagan real estate in SEPTEMBER 2026 and get the region overview below.
The Numbers
| Single Family | Townhouse | Condo / Apartment | |
|---|---|---|---|
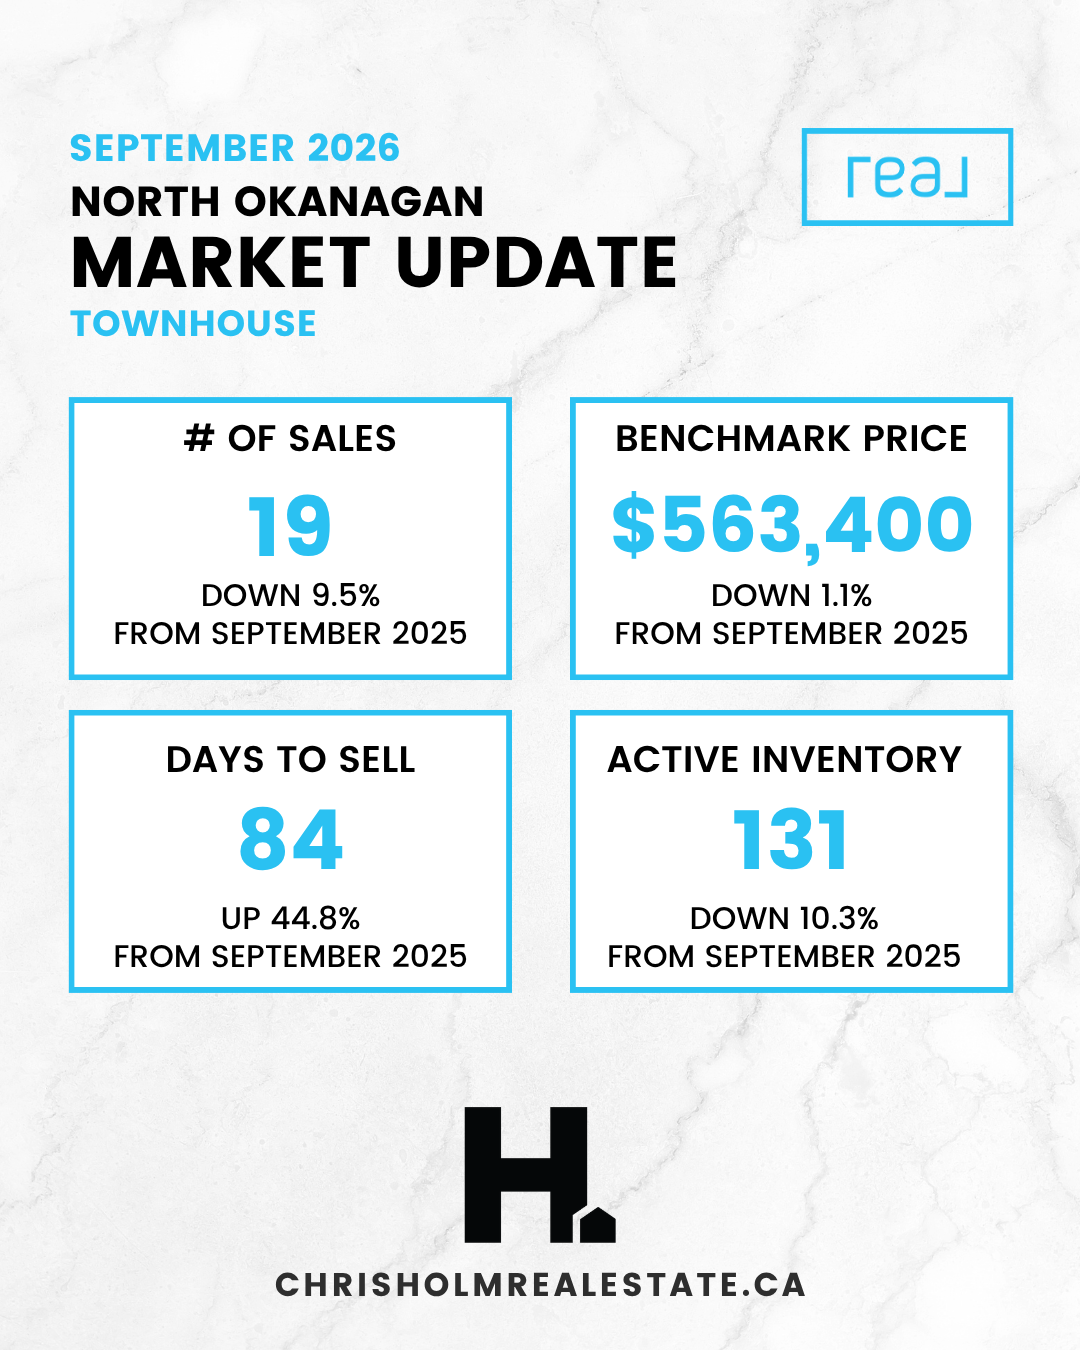
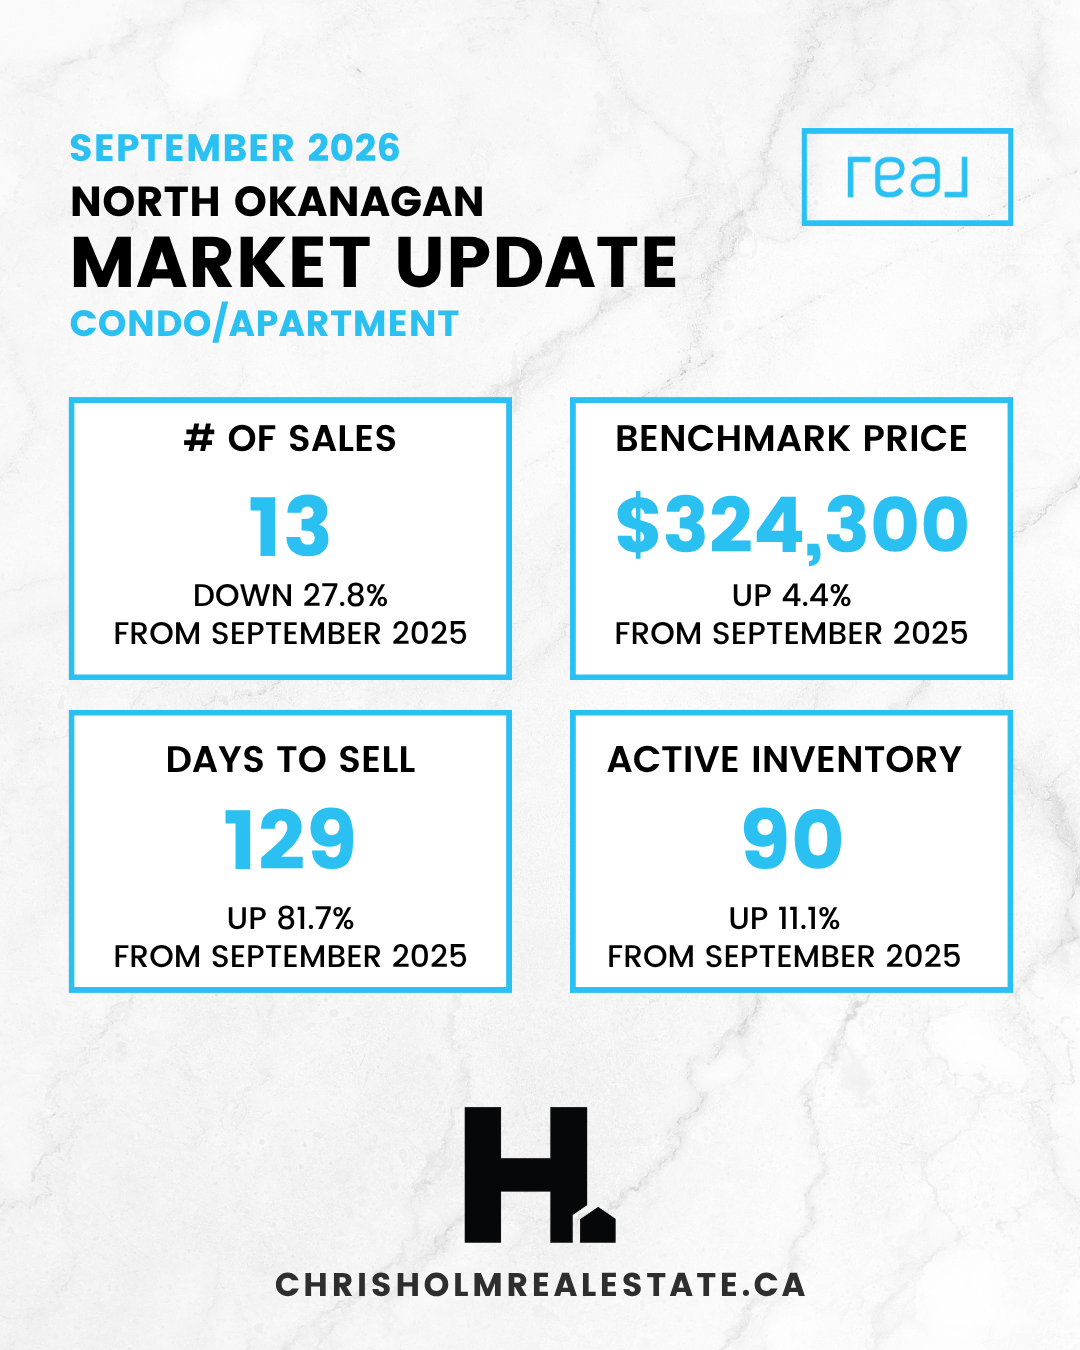
| # of Sales | 64down 21.0% from September 2025 | 19down 9.5% from September 2025 | 13down 27.8% from September 2025 |
| Benchmark Price | $793,000up 5.6% from September 2025 | $563,400down 1.1% from September 2025 | $324,300up 4.4% from September 2025 |
| Days to Sell | 94up 27.0% from September 2025 | 84up 44.8% from September 2025 | 129up 81.7% from September 2025 |
| Active Inventory | 374down 22.1% from September 2025 | 131down 10.3% from September 2025 | 90up 11.1% from September 2025 |
Source: Association of Interior REALTORS®. Benchmark price is the MLS® Home Price Index, which tracks a typical home rather than an average of sale prices. Last month's figures are in the August North Okanagan report, and you can ask our team for a current value on your own home.
Across the Region
Sources: September 2026 Okanagan stats release, Association of Interior REALTORS®
KELOWNA, B.C. – October 5th, 2026. Residential real estate activity across the Interior in September showing signs that the market is beginning to find its footing again after a challenging few months, reports the Association of Interior REALTORS® (the Association).
The Association region recorded 1,141 residential sales in September, on par with the 1,141 units sold in August yet down 8% compared to the same time last year.
New residential listings saw a 13.4% decrease compared to September 2025 with 2,289 new listings recorded last month, up from the previous month’s 2,062 new listings. The total number of active listings saw a 6.8% decrease in inventory compared to the same time last year with 9,185 recorded across the Association region and down compared to August’s 9,378 total inventory.
“Market activity across the Interior is showing early signs of a soft rebound following a challenging few months. While broader geopolitical and economic uncertainty continues to make some buyers and sellers hesitant, inventory isn’t accumulating, which is helping maintain balanced conditions,” says Association of Interior REALTORS® President Ryan Mayne, adding that “we’re also seeing that well-priced homes are being picked up relatively quickly, which is an encouraging sign that the market is gradually moving in the right direction.”
In the Okanagan and Shuswap/Revelstoke regions, the benchmark price for single-family homes saw increases across all sub-regions in September compared to the same month last year, apart from the South Okanagan region that saw a decrease of 6.2%, coming in at $718,400. The townhome housing category saw percentage decreases in all sub-regions, with the highest decrease of 5.7% seen in the South Okanagan region compared to September 2025, coming in at $486,700. The benchmark price in the condominium housing category saw increases in all sub-regions with the highest increase of 6.6% seen in the Shuswap/Revelstoke region compared to the same month last year, coming in at $435,100.
You'll get a person, not a phone tree.
| Chris Holm Personal Real Estate Corp. 250.309.0039 | Patric Tremblay Realtor® 250.306.4690 | Julie Lutz Realtor® 250.241.3114 | Jasmine Hall Realtor® 604.818.4597 | Kristi Boe Office Manager |